This is Not the Social Vulnerability Index
I’m sorry to be the one to tell you, but unfortunately there’s no SVI data here. I will not be regularly updating this repository in the event I find any SVI data either.
Overview
The Centers for Disease Control and Prevention and Agency for Toxic Substances and Disease Registry Social Vulnerability Index (hereafter, CDC/ATSDR SVI or SVI) was a place-based index, database, and mapping application designed to identify and quantify communities experiencing social vulnerability. The Geospatial Research, Analysis & Services Program (GRASP) maintained the CDC/ATSDR SVI to help public health officials and local planners better prepare for and respond to emergency events with the goal of decreasing human suffering, economic loss, and health inequities.
History
The Pandemic and All-Hazards Preparedness Act of 2006 cited that public health preparedness and response capabilities were critical needs for the nation. CDC/ATSDR and the Office of Environmental Health Emergency Management (OEHEM) decided to address social vulnerability as it relates to natural or human-caused hazards and public health emergencies. In 2007, a group including social scientists, geographers, and a statistician within the Geospatial Research, Analysis, and Services Program (GRASP) began developing the Social Vulnerability Index. The first CDC/ATSDR SVI database was released in 2011 and the team published the SVI approach and methodology in the paper titled, “A Social Vulnerability Index for Disaster Management” (Flanagan, B.E., Gregory, E.W., Hallisey, E.J., Heitgerd, J.L., & Lewis, B. (2011).
Methodology
The past CDC/ATSDR Social Vulnerability Index used 16 U.S. Census variables from the 5-year American Community Survey (ACS) to identify communities that may need support before, during, or after disasters. These variables were grouped into four themes that cover four major areas of social vulnerability and then combined into a single measure of overall social vulnerability.
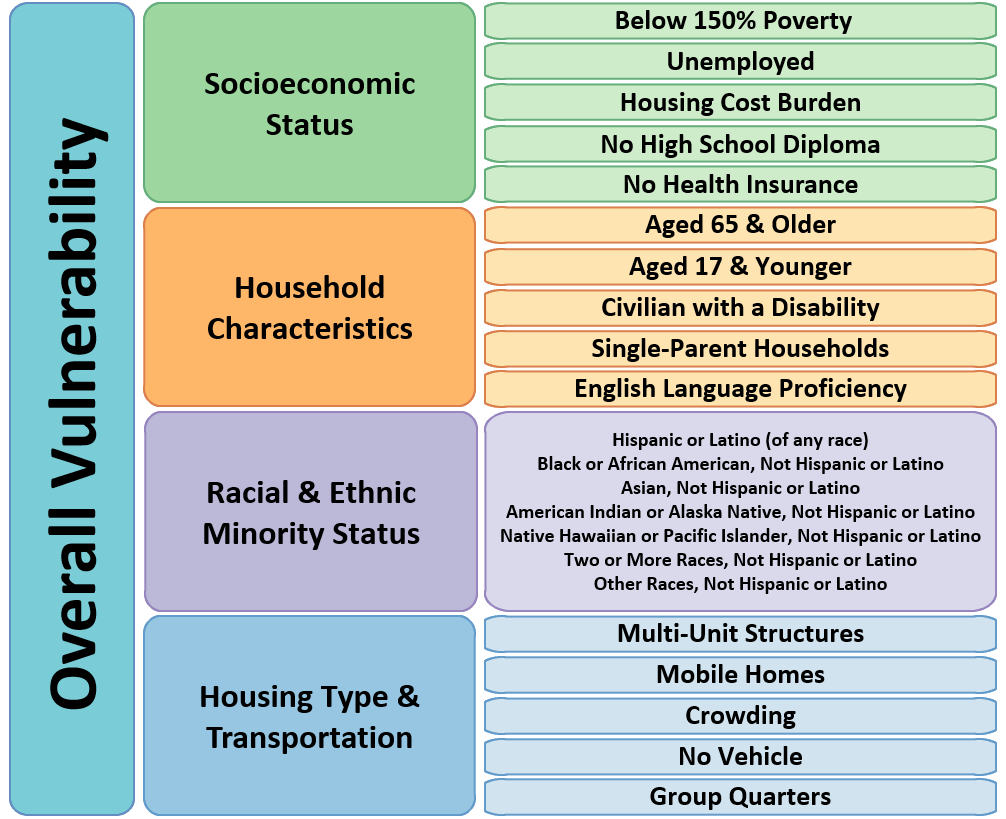 Social Vulnerability Index variables grouped into four themes
Access the CSV file of the Overall Vulnerability image shown above.
Changes over time
The CDC/ATSDR SVI changed four times over the years as can be seen in the timeline below:
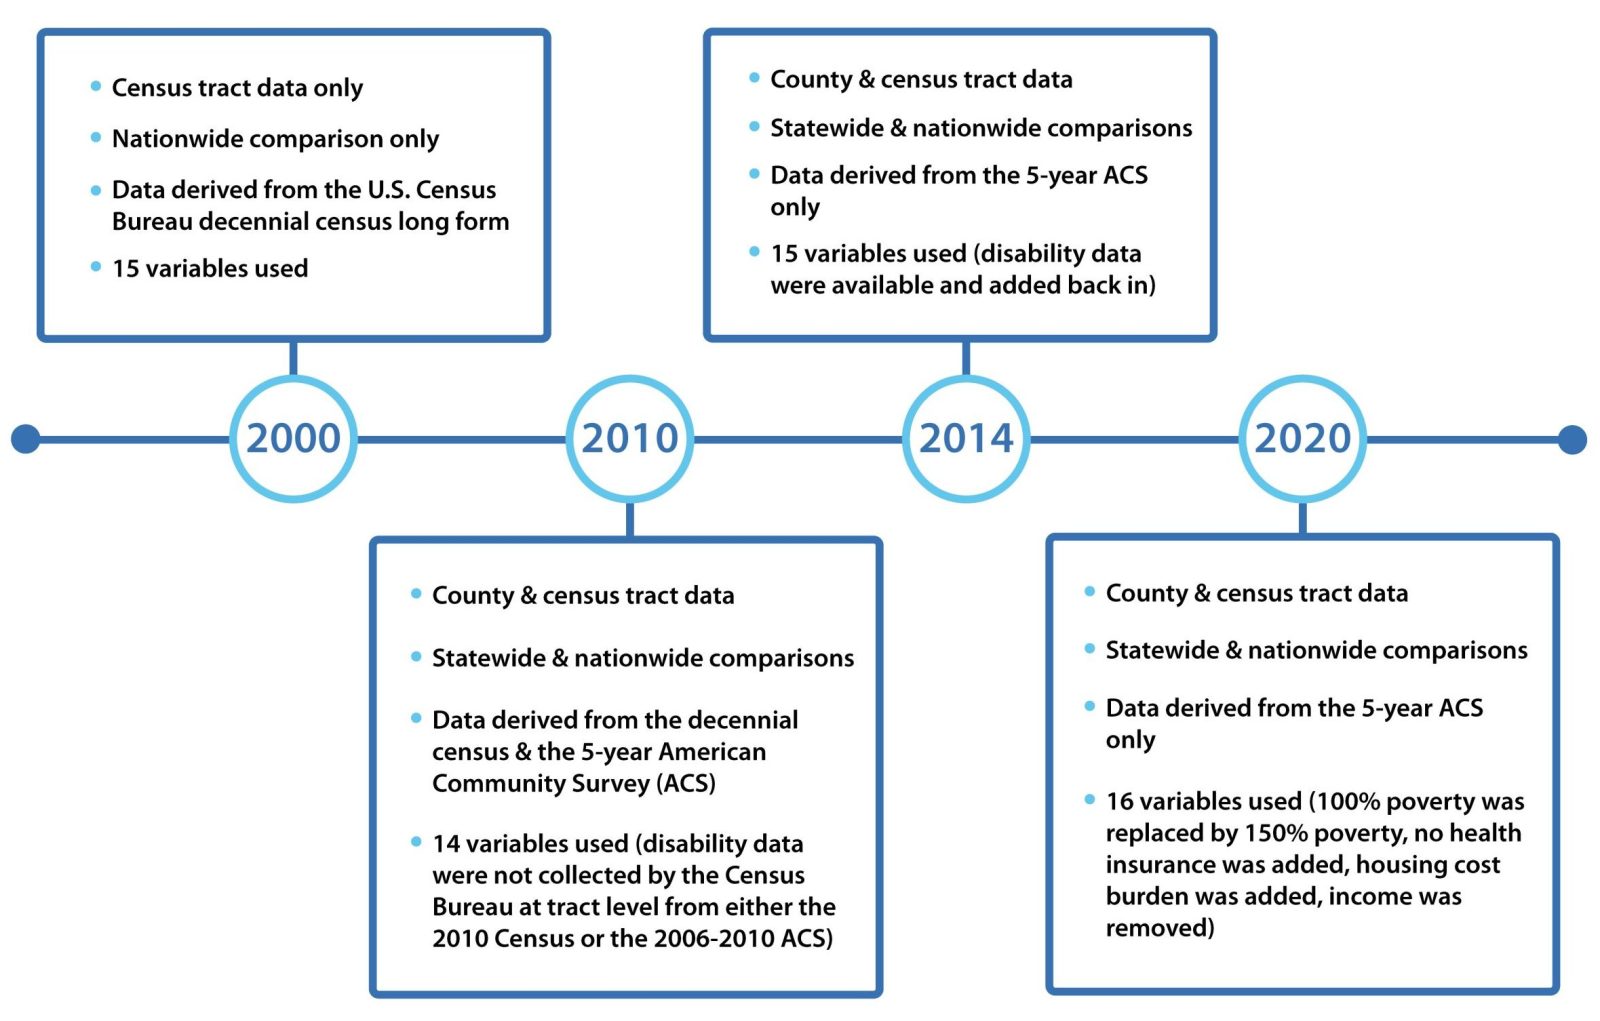 Timeline shows the years SVI changed its database – 2000, 2010, 2014, and 2020.
Access the CSV file of the SVI Changes Over Time image shown above.
SVI County Map Series
The CDC/ATSDR SVI County Map Series included maps of the overall social vulnerability scores, as well as the four themes. These maps depicted the SVI rankings of communities, at the census tract level, within a specified county.
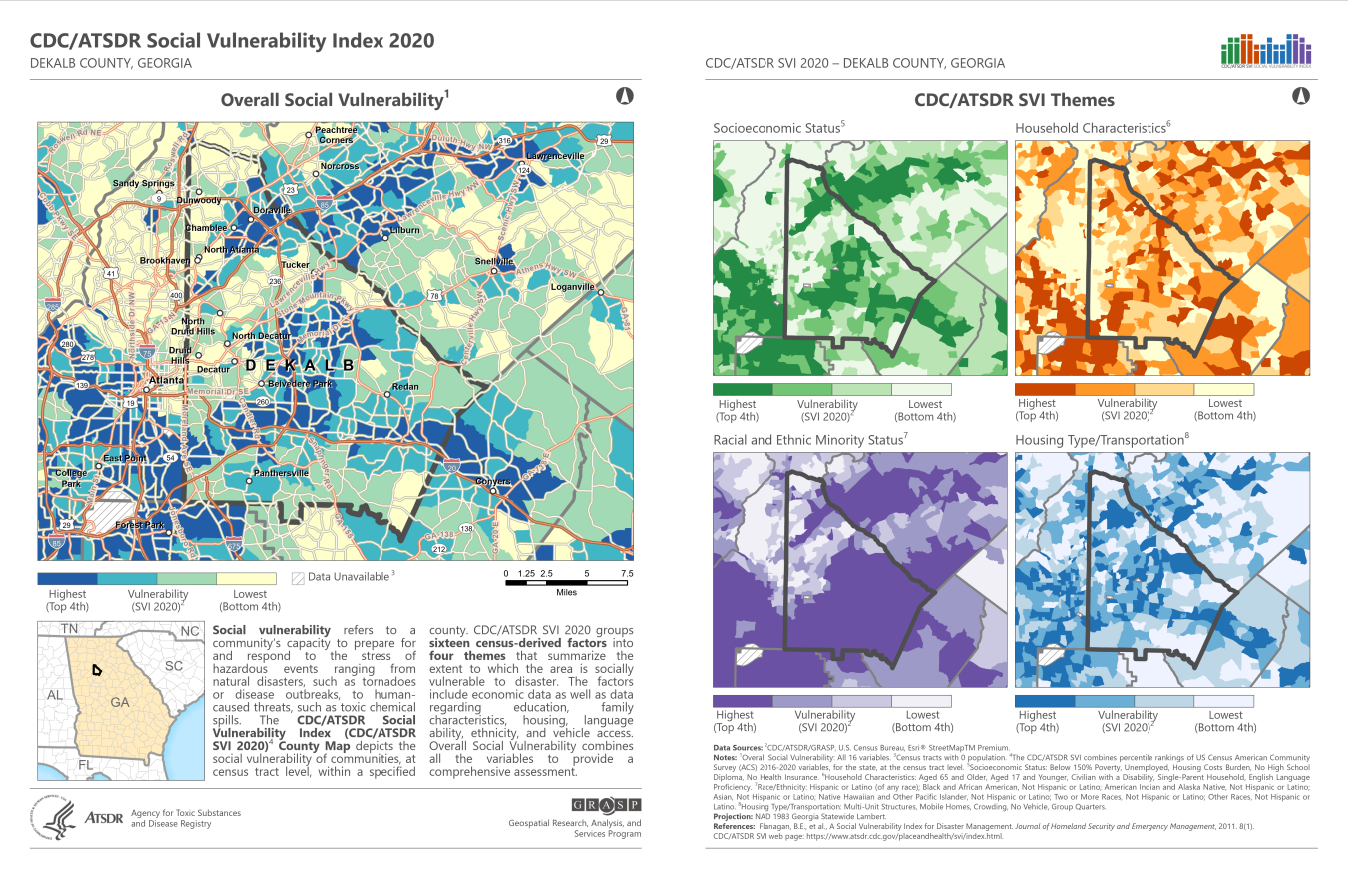 County Map Series